![]()
Home About Basics Casts Theory Verification
References
Contact
Verification fly rod
Purpose
The purpose of this section
is to demonstrate how the rod input, used in the simulation model, is verified.
Method
Each rod is specified by
distributions of:
· Outer diameter. The outer diameter is used to calculate air
drag.
· Bending stiffness. The bending stiffness gives the relation
between bending moment and curvature in static bending. The bending stiffness
distribution determines the rod deflection profile when subject to applied
static loads (in zero gravity).
· Mass density i.e., mass per unit length. The mass density
distribution with the bending stiffness distribution gives dynamic rod
properties e.g., eigenfrequencies.
Here, the method used to
verify the rod distributions is presented with the rod distributions for the 50ft oh ref. cast as an example. The fly rod blank is modeled for each rod
section as a hollow tapered tube with a Young’s modulus and density varying
linearly along the section. The outer diameter is measured but the inner
diameter, Young’s modulus and density are treated as unknowns. The unknowns are
varied until acceptable agreement with experiments is obtained.
Each ferrule
gives an increase in local bending stiffness and mass density.
The guides (including
wrapping) give additions to the mass density with the relative additions being
largest for the tip section. The guides are modeled using a smoothed mass
density distribution giving an addition centered at the position of each guide.
The rod verification method
includes the following measurements:
1. Rod tip deflection for applied loads.
2. Mass for rod sections (zero moment mass distribution).
3. Position for center of mass for rod sections (first moment mass
distribution).
4. Frequency of small amplitude physical pendulum oscillations
(second moment mass distribution).
5. First eigenfrequency for clamped rod vibrations (small
amplitude).
The measurements listed
above were made for:
· the rod top section only.
· The rod top section + 1 section.
· The rod top section + 2 sections.
· The complete rod above the handle (measurements 2, 3 and 4 not applicable).
Used equipment:
· Mass measurements were made using a precision gauge, resolution
0.001 g, accuracy 0.01 g.
· Deflections (on rod sections) were measured using a digital
caliper, resolution 0.01 mm, estimated accuracy 0.25 mm.
· Deflections (large, on complete rod) were measured using a
ruler, estimated accuracy 1 mm.
· Tip angles were measured using a protractor, estimated accuracy
1 deg.
· Eigenfrequencies were measured using video (240 frames per
second) counting 30 cycles, estimated accuracy 0.1%.
· Physical pendulum frequencies were measured using video (60
frames per second) counting 10 cycles, estimated accuracy 0.3%.
· Fixations during measurements were done using clamps and wooden
blocks. Measurements on the complete rod were done using a “3-point fixture for
the rod handle”, shown schematically below:
Measurements on rod sections
were done using wooden blocks with semicircular grooves, shown schematically
below:
The static deflections were measured and
calculated as the vertical differences between tip positions for the unloaded
and loaded rod tip, see example showing the top section in the figure below:
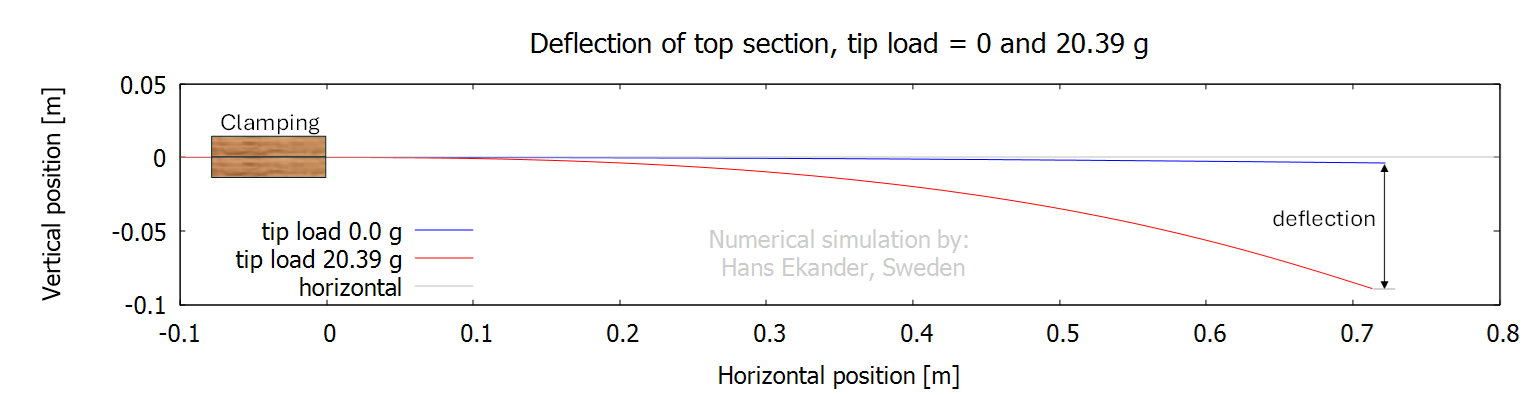
Note: The deflection due to gravity of the
unloaded top section gives a vertical tip deflection of 3.7 mm. The
corresponding figure the complete unloaded rod is
about 52 mm.
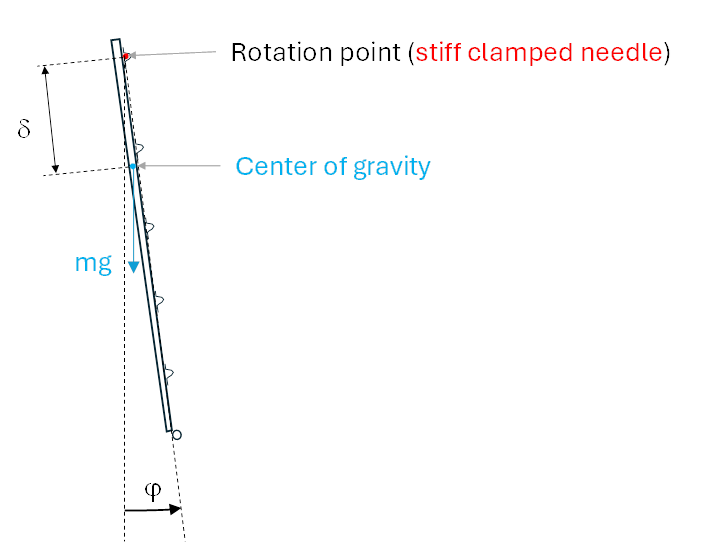
The period for small amplitude oscillations of
a physical pendulum (here rod section(s)) is a function of the moment of
inertia around the rotation point and the restoring torque per unit angle, mgd. It was measured with the
rotation point defined by a needle as sketched below:
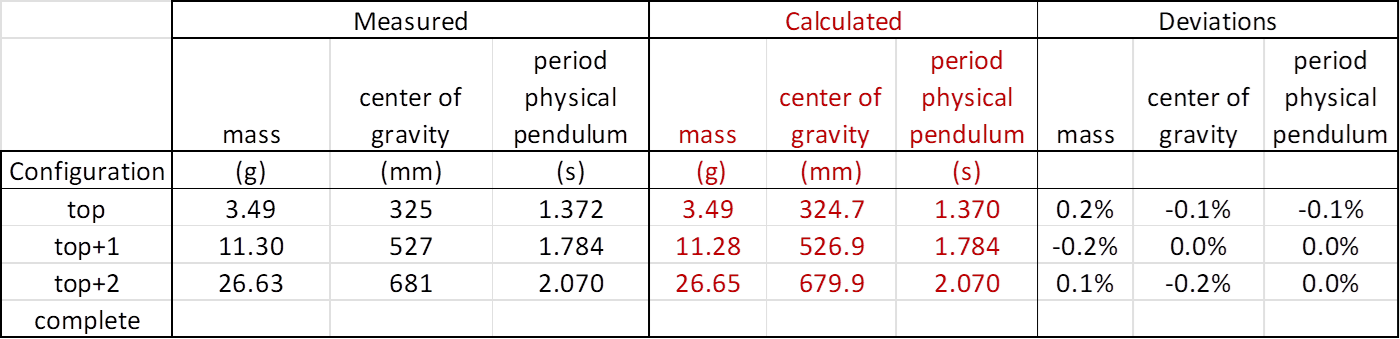
Results, mass distribution:
The outer diameter comparisons are trivial
and are not presented here. Comparisons of experimental data and input to the
simulation model for the mass distributions are shown in the table below:
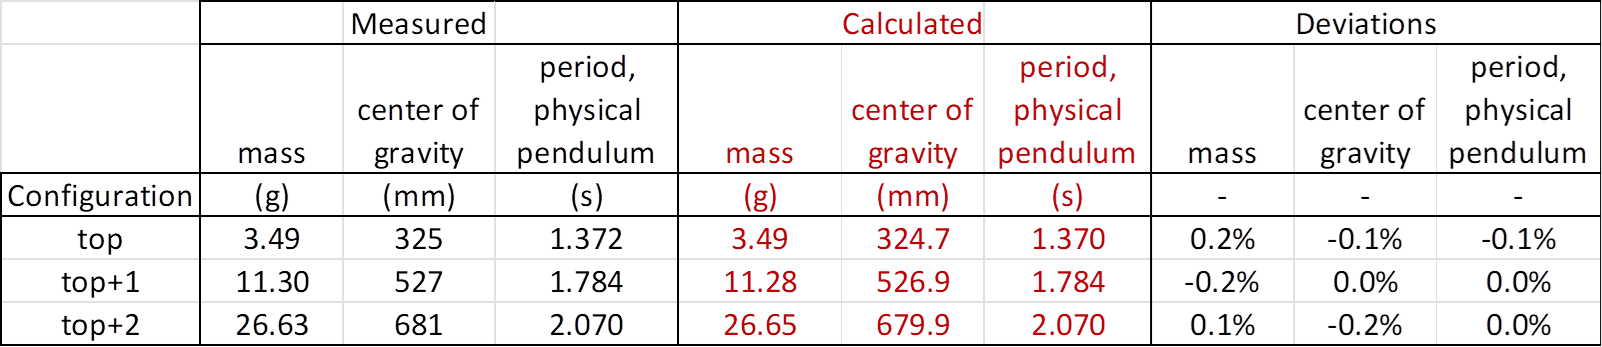
Note: The mass properties for the lower (butt) section of the rod blank isn’t
possible to measure accurately. However, the sensitivity of results for
complete simulations to variations in mass for the butt-section is small.
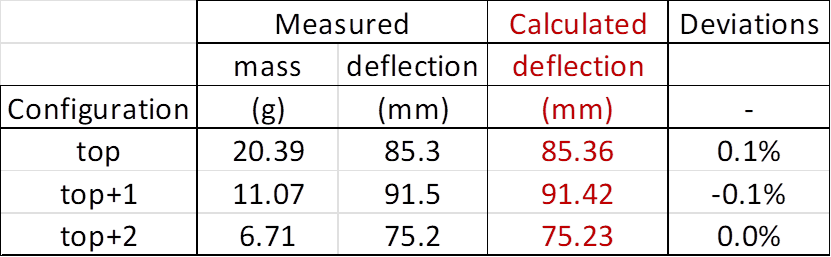
Results, rod stiffness:
Comparisons of experimental data and results
from the simulation model for static deflections on rod sections are shown in
the table below:
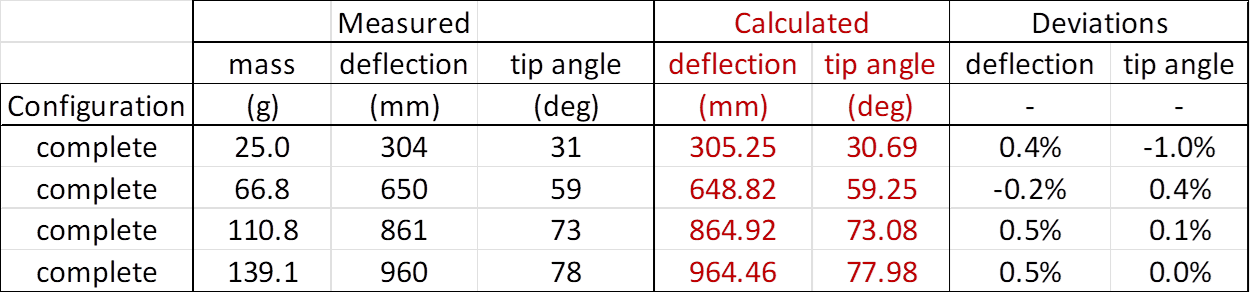
Comparisons of experimental data and results
from the simulation model for deflections and tip angles for the complete rod
are shown in the table below:
The calculated tip mass and tip angle versus
tip deflection are shown in the graph below with the measured points from the
table above:
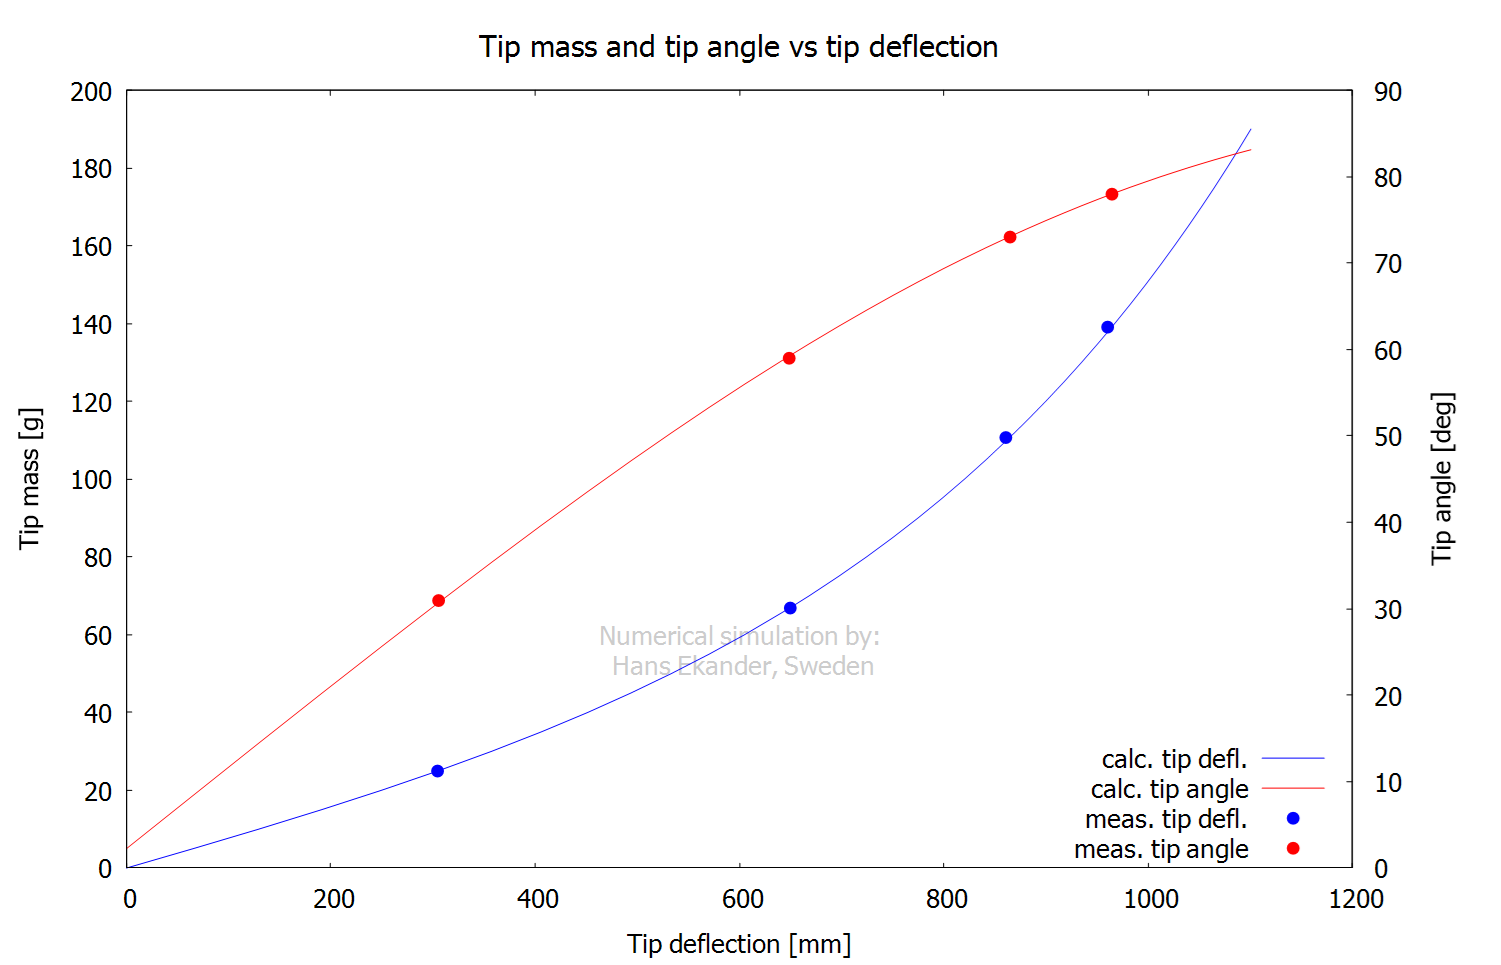
Notes:
· The graph shows the non-linear rod characteristics i.e.; the slope of the tip mass changes about
a factor 5 when the deflection increases from small values to about 1 m (order
of deflection for casts).
· Applying the “common cents” method gives an effective line
number, ELN, for this rod of 5.0 (in agreement with the rod label).
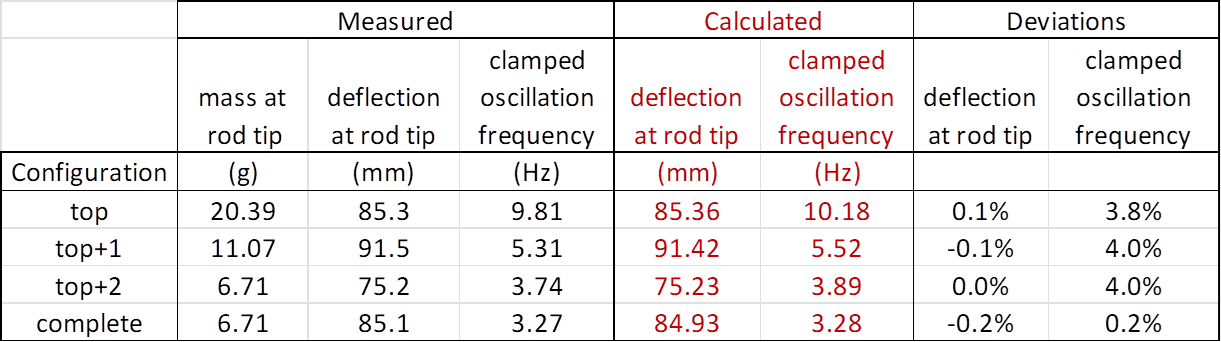
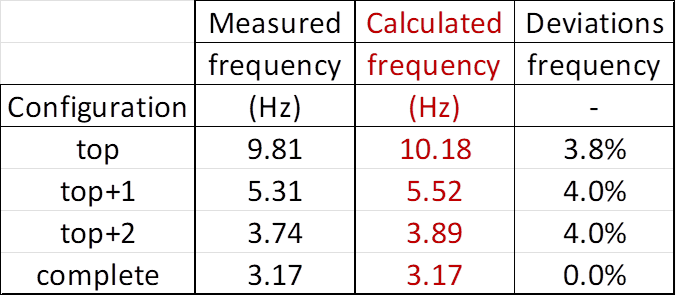
Results, eigenfrequencies:
Comparisons of experimental data and results
from the simulation model for the lowest eigenfrequencies of small amplitude
oscillations are presented in the table below:
Conclusions:
· The calculated mass distribution shows agreement with
measurements within about 0.2%.
· The calculated static deflections shows
agreement with measurements within about 0.5%.
· The calculated tip angle shows agreement with measurements
within about 1.0%.
· The calculated eigenfrequencies deviate up to 4% from the
measurement. The deviations may be partly explained by the physical clamping
not being perfectly rigid (as is the case for the calculated frequencies).
· The agreement between the experiments and the simulated rod model
is concluded to be satisfactory.